Chapter 1 Introduction
1.1 Introduction
Motivation: RNA-sequencing (RNA-seq) has become the most commonly used tool in life science research for exploring whole transcript profiles. The advancement of next-generation sequencing has promoted a large amount of RNA-seq data. However, the popularity of bioinformatics lags far behind the generation of sequencing data, resulting in the inability of most researchers to analyze RNA-seq data. Although a large number of tools are currently available for RNA-seq analysis, data uploading, analysis, and visualization through an interactive interface are more acceptable to researchers than command-line codes.
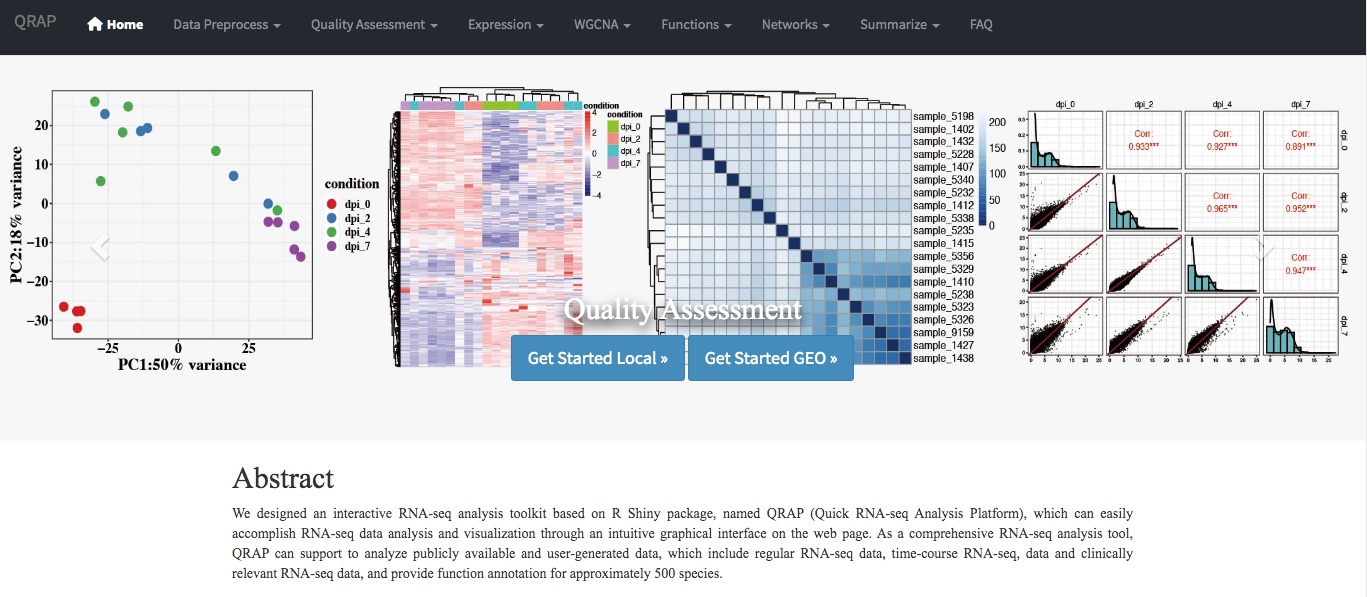
Results: We designed an interactive RNA-seq analysis toolkit based on the R Shiny package, named QRAP (Quick RNA-seq Analysis Platform), which can easily accomplish RNA-seq data analysis and visualization through a user-friendly interface on the web page. As a comprehensive RNA-seq analysis tool, QRAP can support the analysis of publicly available and user-generated data, which include regular RNA-seq data, time-course RNA-seq data, and clinically relevant RNA-seq data, and provide functional annotation for approximately 500 species.
Availability and implementation: As an open source R package, QRAP can be freely accessed at https://github.com/gsx-ucas/QRAP.
1.2 Installation
1.2.1 R package
To install QRAP, R version 4.0 or greater is required. We also recommend installing R Studio.
1.3 Get started
1.3.1 Launch the QRAP application in R or Rstudio
library(QRAP) # loading the QRAP library to R environment
startQRAP() # launch the QRAP application to web browser
Then you would get the link to activate your browser:
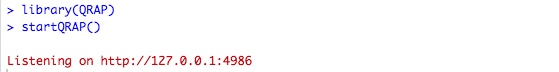
Use the link http://127.0.0.1:4986 to access the interactive analysis interface. Note that the port (4986) should change to yours.
1.3.2 Launch the QRAP application by docker image in shell
docker run -p 3838:3838 goushixue/qrap # use the 3838 port Then you would get the output like this:
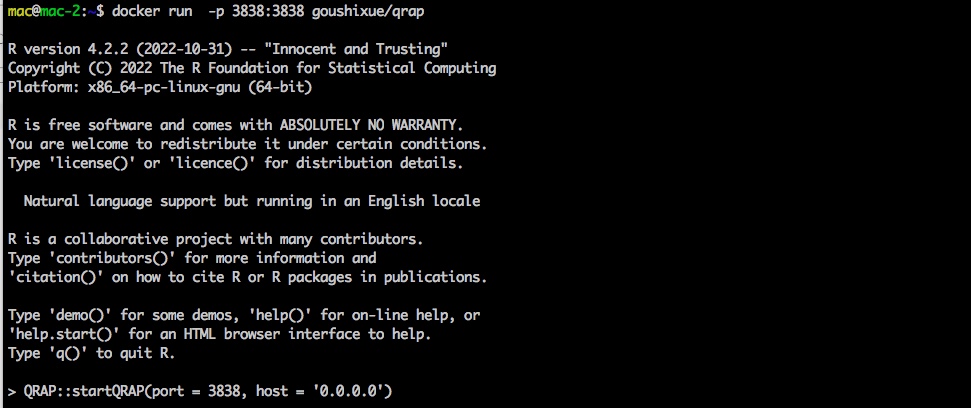
Use the link http://localhost:3838/ to access the interactive analysis interface.